Install
San Jose, CA 95173 Weather
Current conditions
Observed at San Jose, San Jose International Airport · 29 min ago
Forecast
10-day-
Today
Rain showers likely after 3pm. Mostly cloudy. High near 72, with temperatures falling to around 68 in the afternoon. North northwest wind 0 to 5 mph. Chance of precipitation is 70%. New rainfall amounts less than a tenth of an inch possible.
-
Tonight
Rain showers likely before 1am, then a chance of rain showers and patchy fog. Mostly cloudy, with a low around 53. Northwest wind around 3 mph. Chance of precipitation is 60%. New rainfall amounts between a tenth and quarter of an inch possible.
-
Thursday
Rain showers and patchy fog. Mostly cloudy. High near 68, with temperatures falling to around 65 in the afternoon. South wind 1 to 6 mph. Chance of precipitation is 80%. New rainfall amounts between a tenth and quarter of an inch possible.
National Weather Service forecast updated 1 hr ago.
Hourly
Hourly forecast- Now65°
- 12 PM68°
- 1 PM69°
- 2 PM70°13%
- 3 PM69°21%
- 4 PM68°38%
- 5 PM68°69%
- 6 PM65°43%
- 7 PM64°33%
- 8 PM63°31%
- 9 PM61°28%
- 10 PM60°31%
- 11 PM59°60%
- Thu12 AM58°56%
- 1 AM57°52%
- 2 AM56°54%
- 3 AM55°45%
- 4 AM55°47%
- 5 AM54°52%
- 6 AM53°49%
- 7 AM54°44%
- 8 AM55°38%
- 9 AM58°46%
- 10 AM61°44%
Daily forecast
Details- TodayOct 21Mostly Cloudy then Rain Showers Likely69%53°72°
- ThuOct 22Rain Showers82%50°68°
- FriOct 23Patchy Fog then Mostly Sunny45°72°
- SatOct 24Patchy Fog then Sunny49°75°
- SunOct 25Mostly Sunny49°76°
- MonOct 26Mostly Sunny48°74°
- TueOct 27Mostly Sunny49°74°
- WedOct 28Mostly sunny48°72°
- ThuOct 29Cloudy52°76°
Days after the National Weather Service's seven are MET Norway's outlook, a computer model with no forecaster's review.
Radar
Full mapWeather news in California
More weather news-
 California's rainy season to arrive with flood threat, tornado risk and Sierra snow
California's wet season is starting off with a bang. The first significant storm of the season is forecast to bring heavy rain to vulnerable burn scars near Big Sur, coastal tornado risk to the Los Angeles area, and a…
-
 Storms descend on Southern California, raising risk of dangerous surf, flooding, debris flows
Rain is anticipated for Southern California on Wednesday into Thursday as the National Weather Service cautioned about potential beach hazards and thunderstorms from Oxnard to the Mexico border. The weather service's…
-
 Southern California's wild weather swings continue. Next up, rain
Southern California is likely in for a solid dose of rain this week, just days after heat and Santa Ana winds helped fuel several wildfires across the region. Forecasters expect the bulk of the rain to roll into the Los…
-
 Waterspouts possible off Southern California amid stormy weather
Southern California's stormy forecast includes a chance of isolated waterspouts offshore. They may look like tornadoes, but they're not. Our latest explainer breaks down what waterspouts are, how they form over the…
-
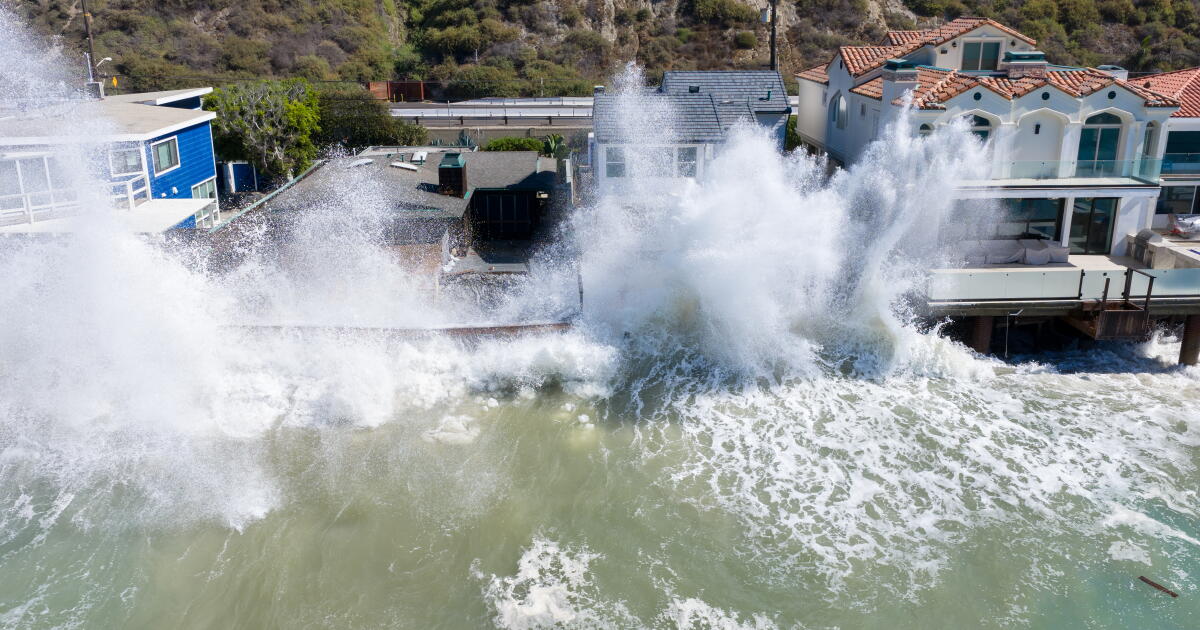 Rain and Thunderstorms Expected in Southern California with Beach Hazard Warnings
At SSBCrack News, our dedicated editorial team brings you the latest and most reliable updates on Defence, Geopolitics, Military Affairs, Science, and Technology. Driven by a passion for national security and strategic…
-
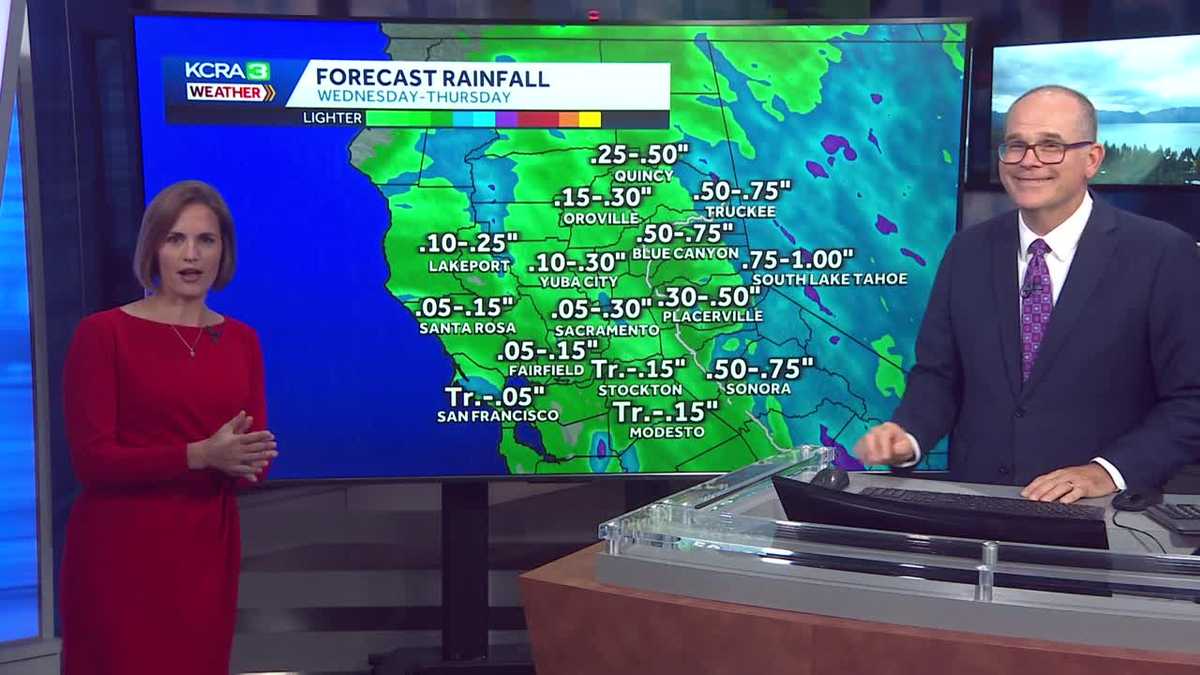 California weather with Dirk & Heather: Showers, thunderstorms and snow
Wednesday and Thursday will be cool and unsettled with scattered downpours. The first rain chances of the new water year are coming up quickly in Northern California! Wednesday and Thursday will be cool, cloudy and at…
- Flash-flood risk rises in Southern California, severe storms threaten Arizona
Satellite image of southwest U.S. at 17:20 UTC on October 20, 2026. Credit: NOAA/GOES-19, Zoom Earth, The Watchers The WPC Excessive Rainfall Discussion issued at 15:33 UTC on October 20 places portions of Southern…
-
 Mid-October Santa Ana winds rapidly spread wildfires in Southern California
Several fires have erupted recently amid strong, dry winds known as the Santa Anas. The name is commonly linked way back in the 1800s to Santa Ana Canyon in Orange County, through which these warm winds were known to…
- Winter weather advisory for California for Wednesday and Thursday
The NWS Hanford CA released a winter weather advisory at 12:51 p.m. on Tuesday valid from Wednesday 11 a.m. until Thursday 11 a.m. The advisory is for Yosemite, Upper San Joaquin River, Kaiser to Rodgers Ridge, Kings…
-
 California Will Turn Clocks Back on November 1
California residents will turn their clocks back one hour on Sunday, November 1, 2026, when daylight saving time ends across most of the United States. The change will provide an additional hour overnight but bring…
Air quality
Acceptable. Unusually sensitive people should consider limiting prolonged outdoor exertion.
Forecast
- WedGood (38)
- ThuGood (44)
- FriGood
San Jose, CA reporting area · 2 hrs ago. Data from AirNow (EPA and its state, local and tribal partners); preliminary and subject to change.
Sun & moon
Almanac
MonthlySan Jose Area, records since 1893. Normals 1991–2020. Data from NOAA's Regional Climate Centers (ACIS).
Nearby
- Fremont 25 km
- Hayward 41 km
- Sunnyvale 13 km
- Santa Clara 6 km
- San Mateo 46 km
- San Leandro 49 km
- Livermore 40 km
- Redwood City 35 km
- Mountain View 18 km
- Pleasanton 36 km
- Alameda 58 km
- Milpitas 10 km
Forecasters' discussion
From the National Weather Service office in MTR, issued 13 min ago
Key Messages
Updated at 801 PM PDT Tue Oct 20 2026
- Cooling trend continues through the end of the week
- Beneficial light rain showers expected Wednesday through Thursday
- Thunderstorms possible Wednesday afternoon into Thursday morning across Central Coast
- Warm and dry next weekend
Update
Issued at 939 AM PDT Wed Oct 21 2026
We are starting to see the some of the first rain bands moving into the north Central Coast this morning as the core of the cut-off upper level low approaches the region. There aren't currently any lighting strikes as of yet across the region this morning. However, we are expecting that to change as we head into late morning and moreso this afternoon and evening. This is as instability increases with up to 400-800 J/kg of MUCAPE (Most Unstable Convective Available Potential Energy). The greatest instability is forecast to remain over the north Central Coast and points southward. All eyes remain on the burn scars of the Timber and Plaskett fires given the threat for debris flows. Rain rates across these regions matter and the scattered nature of these showers and/or thunderstorms gives us less confidence of exactly how much rainfall will occur over any given one area. Please see the AFD for the Short Term for additional details.
RGass
Short Term
Issued at 1230 AM PDT Wed Oct 21 2026 (Today and tonight)
The center of the 500 mb cut-low is inching closer to the coast as the sub-tropical jet stream supports the left portion of the system, bringing enhanced momentum and moisture flux. This is where the most instability and lift can be found. As of 11:30 PM PDT, KMUX radar is picking up on a few cells offshore exhibiting a ~10-25% chance of lightning with a few lightning strikes observed along the occluded front (~250-300 miles SW from Monterey). The current offshore activity is foreshadowing what is to come early Wednesday morning.
The first few rain bands are expected to make their way over the Central Coast just before sunrise. Going into the afternoon, precipitation gets wrapped around the system's center and eventually spreads through the rest of the Bay Area. Precipitable water is expected to rise above the 90th percentile for this time of year, which prompted WPC to include the southern Central Coast in a marginal risk of excessive rainfall for Wednesday.
To further assess the potential for severe thunderstorms, three high- resolution model soundings were analyzed: the 3km NAM, 10km RDPS, and the RRFS. Keep in mind that the NAM tends to be the most pessimistic model out of the three in terms of moisture. Upon evaluation of the near-storm environment for each, there are a few inconsistencies across the models in terms of the severe thunderstorm threat and whether the environment is conducive to tornado spin-ups.
Before getting into what *is* consistent across the models, let's run through a quick overview of a couple notable stability indices: the Total-Totals and K index. The Total-Totals index measures atmospheric instability by taking the thermal difference between 850 to 500 mb to identify the potential for severe thunderstorms or tornadoes. The K index is used to assess atmospheric buoyancy by measuring the low to mid-level moisture as well as the 850-500 mb thermal difference. The greater the K index value, the greater the potential is for widespread thunderstorms (K > 20 = scattered thunderstorms, K > 35 = numerous thunderstorms). Similarly, higher Total-Totals (TT) index values indicate an enhanced potential for severe thunderstorms and/or tornadoes (TT > 48 = severe thunderstorms, TT > 50 = tornadoes).
Why am I talking about stability indices? Well, according to these indices and other environmental parameters, the three high-res model soundings that were analyzed all indicate a heightened risk for at least scattered, severe thunderstorms along the Big Sur coastline. The NAM estimates TT ~ 56 and a K index ~ 36, RDPS estimates TT ~ 54 and a K index ~ 30, and RRFS estimates TT ~ 50 and K index ~ 31.
Long Term
Issued at 1230 AM PDT Wed Oct 21 2026 (Thursday through Tuesday)
The rain and thunderstorm threat are gone by Friday. With the trough to our east, building high pressure brings warm and dry conditions into early next week. Euro and GFS ensemble members suggest warming to near seasonal averages meanwhile precipitable water values are forecast to dip below the 25th percentile. Monday onward, there is a great deal of uncertainty on when the weak ridge breaks down. An energetic Central Pacific plus the most recent 6-10 day Climate Prediction Center precipitation outlook suggests another trough coming our way with the potential for more rain.
Forecasts, observations and alerts in the United States come from the National Weather Service (NOAA); radar from NOAA's Multi-Radar Multi-Sensor system; satellite imagery from NASA's Global Imagery Browse Services (GIBS) and NOAA's GOES satellites; the map from the U.S. Geological Survey's National Map; air quality from AirNow (EPA and its partners); hurricane information from the National Hurricane Center; climate normals and records from NOAA's Regional Climate Centers (ACIS). Forecasts outside the United States and the UV index: MET Norway (CC BY 4.0); observations outside the U.S.: airport reports via NOAA's Aviation Weather Center. Place names: GeoNames (CC BY 4.0). Data are copied on a schedule and may lag the sources; for warnings that affect your safety, follow your local National Weather Service office and emergency officials. Weather news is drawn from the 4Conservative index and reflects what the press published. Terms of use.