Install
San Jose, CA 95127 Weather
Current conditions
Observed at San Jose, San Jose International Airport · 38 min ago
Forecast
10-day-
Today
Partly sunny. High near 72, with temperatures falling to around 70 in the afternoon. West wind 1 to 7 mph.
-
Tonight
A chance of rain showers after 10pm. Mostly cloudy. Low around 52, with temperatures rising to around 54 overnight. South southeast wind 1 to 5 mph. Chance of precipitation is 30%. New rainfall amounts less than a tenth of an inch possible.
-
Wednesday
A chance of rain showers before 7am, then rain showers likely and patchy fog. Mostly cloudy. High near 71, with temperatures falling to around 68 in the afternoon. Southwest wind 1 to 5 mph. Chance of precipitation is 60%. New rainfall amounts less than a tenth of an inch possible.
National Weather Service forecast updated 5 hrs ago.
Hourly
Hourly forecast- Now67°
- 1 PM69°
- 2 PM70°
- 3 PM72°
- 4 PM71°
- 5 PM70°
- 6 PM68°
- 7 PM64°
- 8 PM62°
- 9 PM61°
- 10 PM60°16%
- 11 PM59°27%
- Wed12 AM58°26%
- 1 AM57°27%
- 2 AM56°28%
- 3 AM55°27%
- 4 AM54°32%
- 5 AM54°30%
- 6 AM53°32%
- 7 AM53°44%
- 8 AM53°47%
- 9 AM56°40%
- 10 AM60°28%
- 11 AM64°34%
Daily forecast
Details- TodayOct 20Partly Sunny32%52°72°
- WedOct 21Rain Showers Likely62%52°71°
- ThuOct 22Chance Rain Showers49%50°68°
- FriOct 23Patchy Fog then Sunny49°72°
- SatOct 24Sunny52°76°
- SunOct 25Mostly Sunny51°75°
- MonOct 26Sunny50°74°
- TueOct 27Cloudy61°83°
- WedOct 28Cloudy57°80°
Days after the National Weather Service's seven are MET Norway's outlook, a computer model with no forecaster's review.
Radar
Full mapWeather news in California
More weather news-
 Mid-October Santa Ana winds rapidly spread wildfires in Southern California
Several fires have erupted recently amid strong, dry winds known as the Santa Anas. The name is commonly linked way back in the 1800s to Santa Ana Canyon in Orange County, through which these warm winds were known to…
-
 California Will Turn Clocks Back on November 1
California residents will turn their clocks back one hour on Sunday, November 1, 2026, when daylight saving time ends across most of the United States. The change will provide an additional hour overnight but bring…
-
 Pacific Storm Brings Rain and High Elevation Snow to Northern California
SuaraGarut.ID A Pacific storm moving south along the West Coast is bringing cooler temperatures, breezy winds, and scattered precipitation to Northern California this week According to KCRA meteorologists, rain chances…
-
 Rain — and potentially lots of it — heading to Southern California
Widespread rain and possible thunderstorms are headed for Southern California this week, with forecasters on Monday warning that some areas could receive up to 2 inches of rain. The National Weather Service said a…
-
 Cooler temperatures, possible rain headed for Southern California
It’s time to grab those jackets and pull out the umbrellas because cooler temperatures and a chance of rain is on tap for Southern California by the middle of this week, forecasters say. The region could see widespread…
-
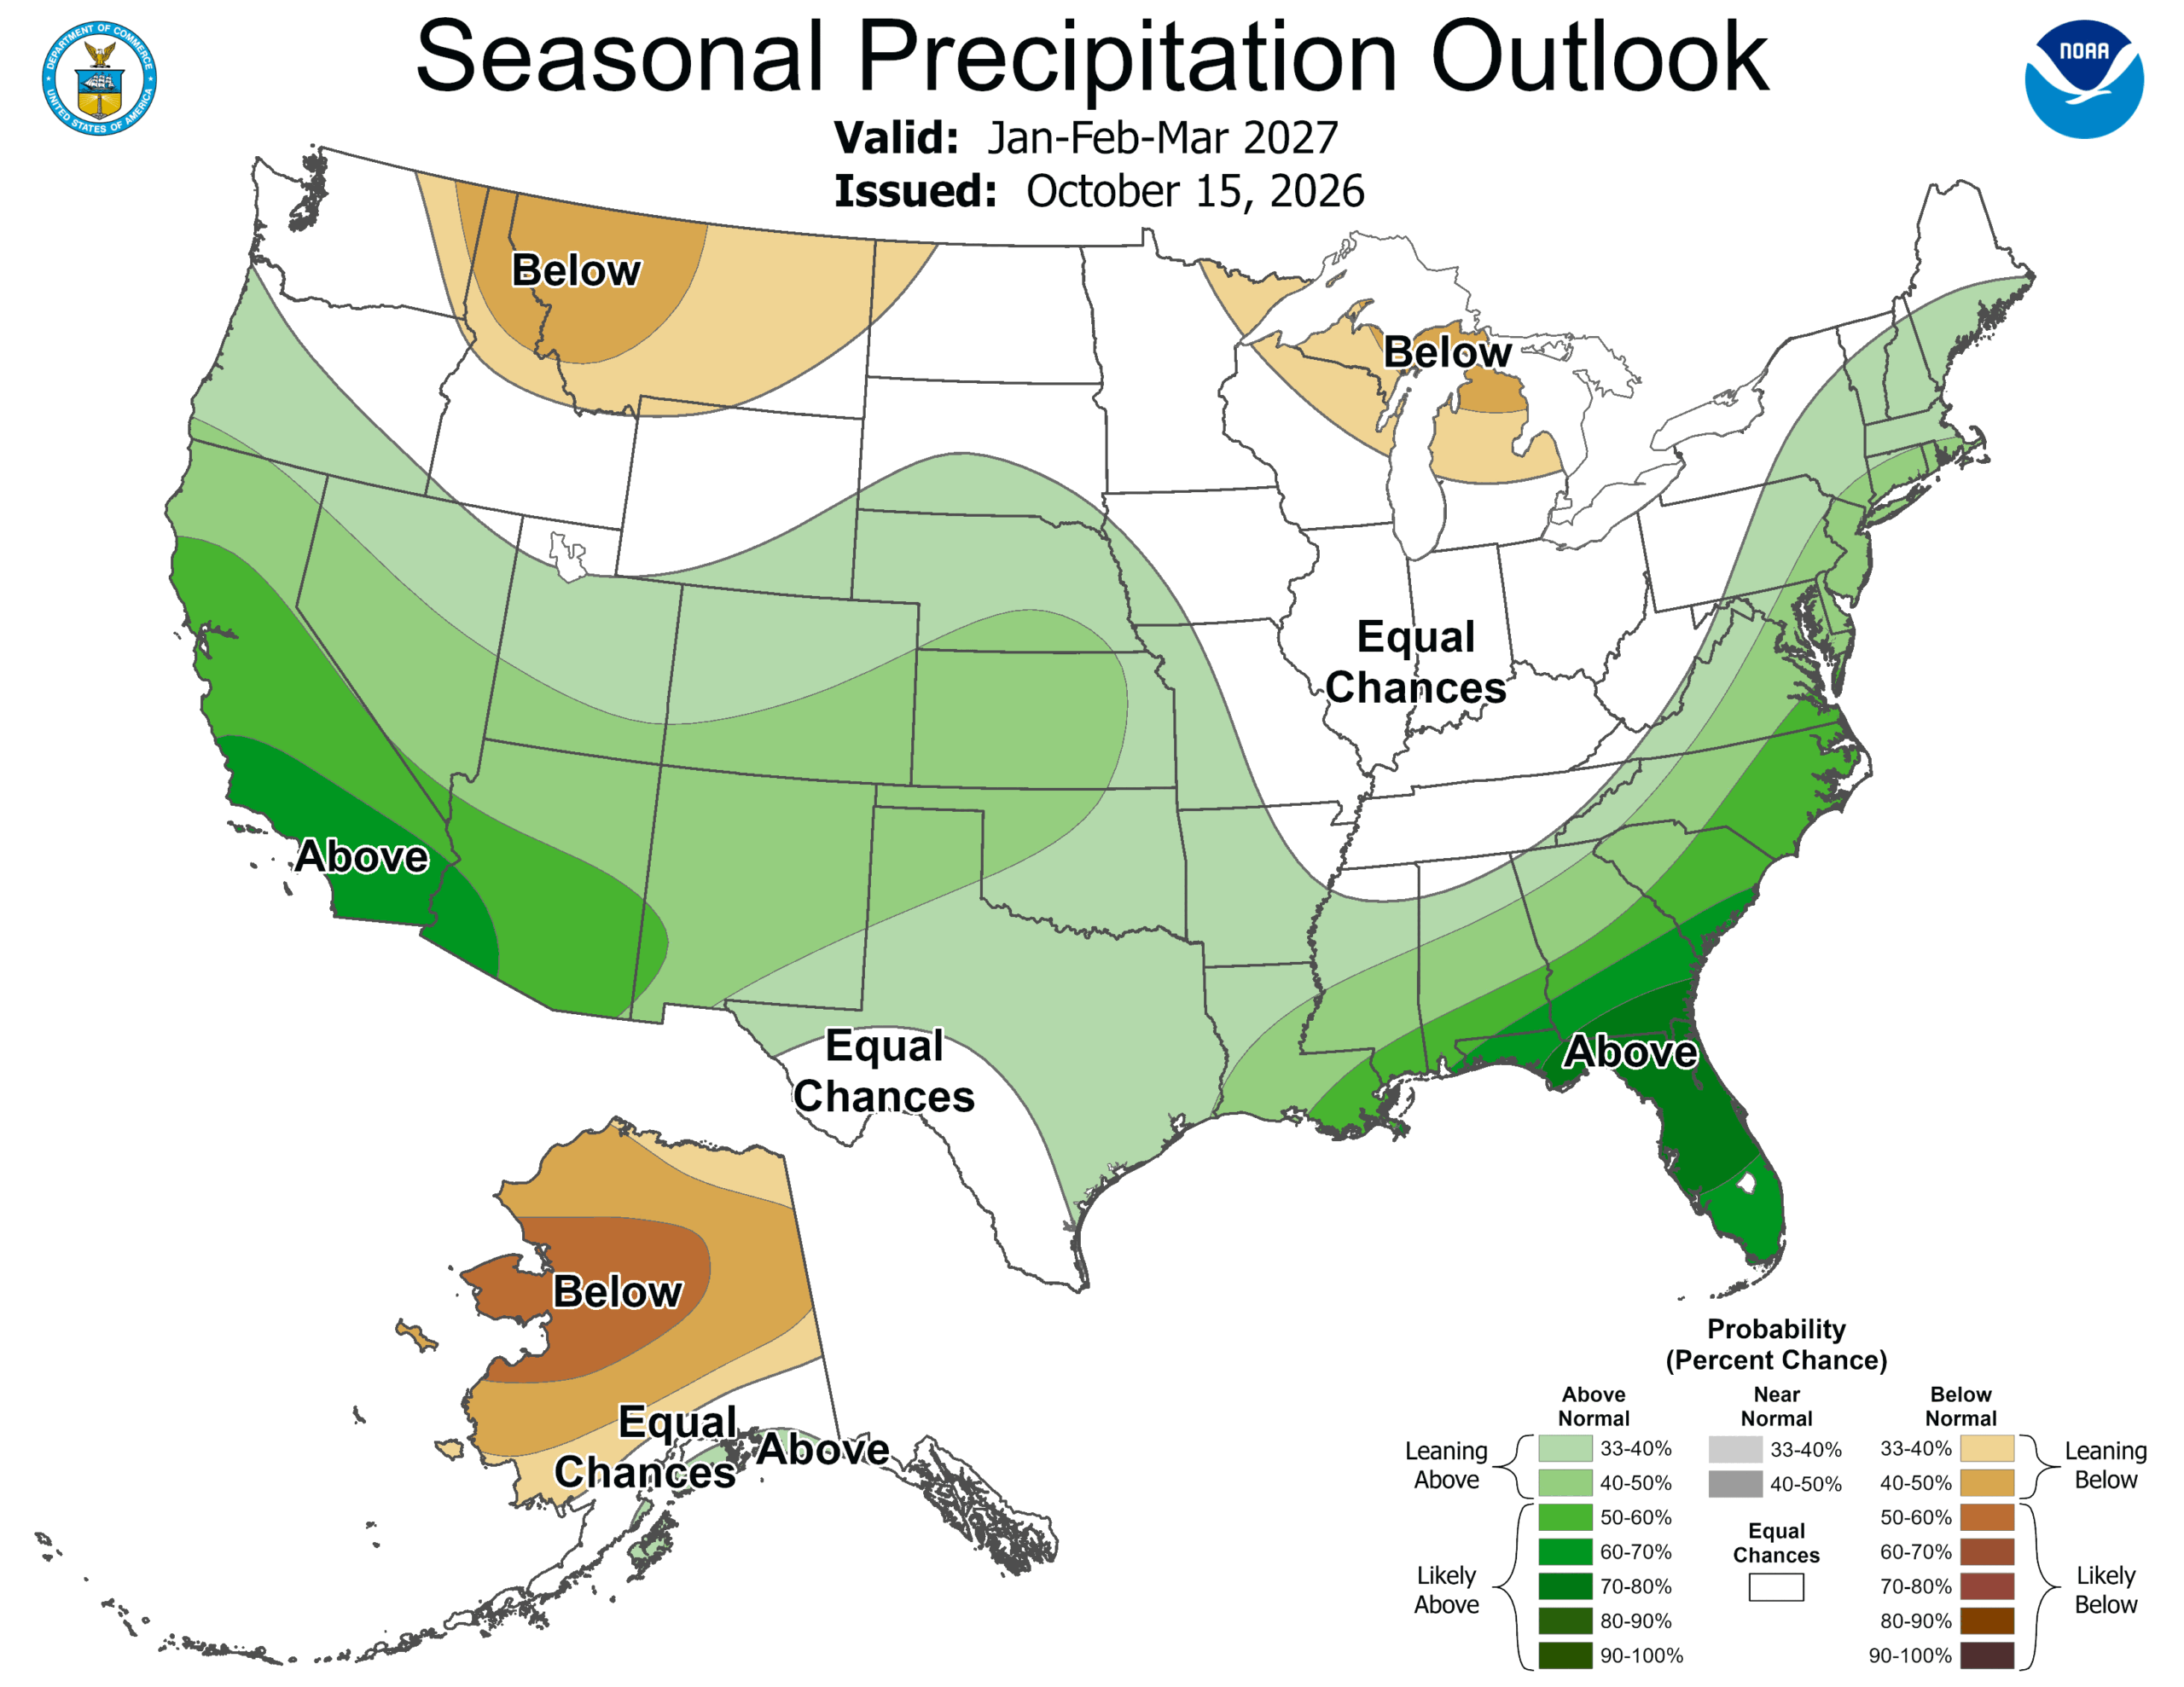 ‘Weather Whiplash’ Bringing Back Rain and Snow to California
A “weather whiplash” will continue taking Californians for a ride this week, as last week’s high temperatures and blustery winds give way to clouds, rain and snow in the mountains. This week, the stormy weather returns…
- Deep Pacific storm targets Central California, raising rain chances by Wednesday
by Ilya Neyman, Chief Meteorologist Tonight, there is a potent mid-latitude cyclone developing over the North Pacific, just west of Washington state. A very robust jet stream, with winds of close to 200 mph, is…
-
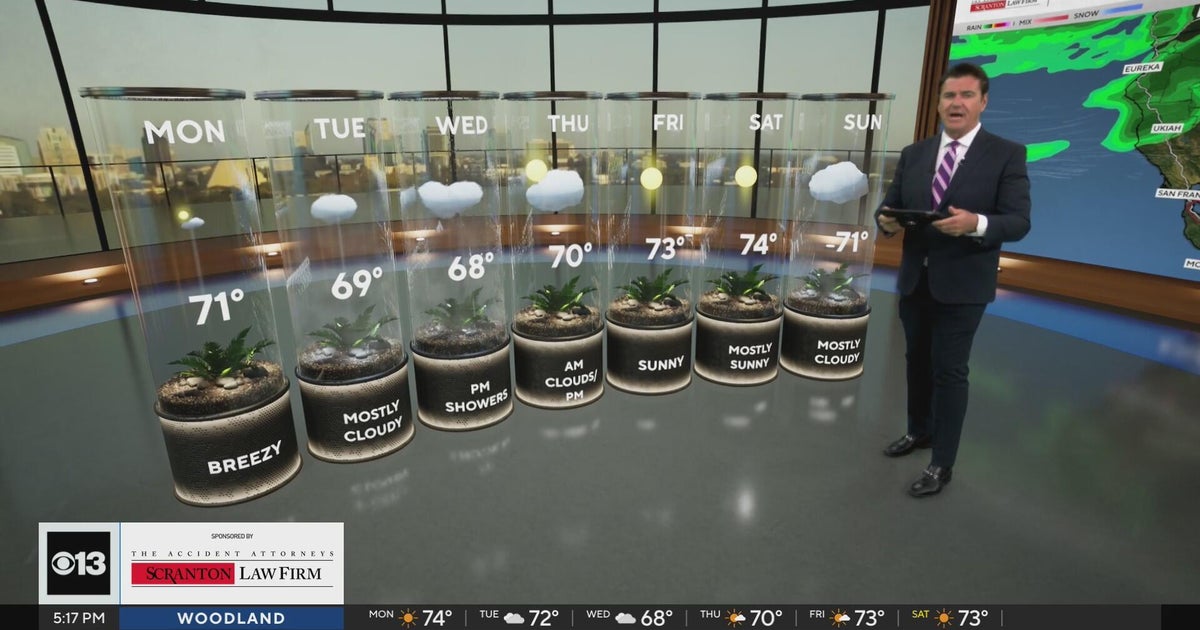 Sunday evening Northern California weather forecast - October 18, 2026
CBS News Bay Area Evening Edition Weekend 5pm CBS News Detroit Weekend 6:30pm CBS News Miami 6:30pm CBS Philadelphia at 6:30pm What's in Season with Michael Marks CBS News Texas 5:30pm
-
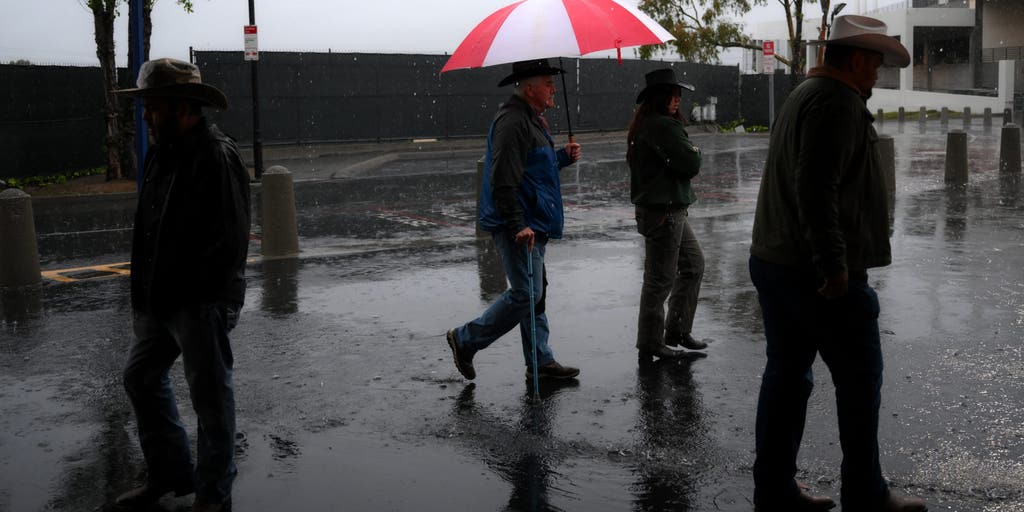 California storms could bring much-needed rain and relief to wildfire-weary areas
🔥 FIRE RELIEF: Wet weather is headed for California just in time as wildfires rage across the state, bringing much-needed relief to the fiery conditions this week. CALIFORNIA - As numerous wildfires burn across parts of…
-
 Incoming storm to bring renewed flood risk to California, Southwest
Tropical moisture will fuel downpours across California and the Southwest this week, raising the risk of flash flooding and mudslides. Published Oct 18, 2026 11:09 AM EDT | Updated Oct 18, 2026 3:09 PM EDT Dramatic…
Air quality
Acceptable. Unusually sensitive people should consider limiting prolonged outdoor exertion.
Forecast
- TueGood (44)
- WedGood (38)
- ThuGood
San Jose, CA reporting area · 1 hr ago. Data from AirNow (EPA and its state, local and tribal partners); preliminary and subject to change.
Sun & moon
Almanac
MonthlySan Jose Area, records since 1893. Normals 1991–2020. Data from NOAA's Regional Climate Centers (ACIS).
Nearby
- Fremont 25 km
- Hayward 40 km
- Sunnyvale 19 km
- Santa Clara 12 km
- San Mateo 49 km
- San Leandro 49 km
- Livermore 35 km
- Tracy 54 km
- Redwood City 39 km
- Mountain View 23 km
- Pleasanton 33 km
- Alameda 59 km
Forecasters' discussion
From the National Weather Service office in MTR, issued 3 hrs ago
Key Messages
Updated at 1200 PM PDT Mon Oct 19 2026
- Cooling trend continues through the end of the week
- Beneficial light rain showers expected mid-week
- Thunderstorms possible mid-week across southern Central Coast
Update
Issued at 856 AM PDT Tue Oct 20 2026
Looking out the window, yes sometimes we do just look out the window, we can see cirrus and even some accas. Both of these cloud types can be precursors to a pattern change. If we take a broader look at satellite the bands of clouds currently west of Monterey are the leading edge of an occluded low pressure parked off the coast. Additionally, the bands east of Monterey are likely tied to the position of an upper level jet (GOES West shows strong winds in the 250-450mb range). The accas can be a good indicator of moisture and lower-mid level instability. If you haven't noticed, KMUX is still in precip mode. We are now picking up a few echoes well offshore closer to the low pressure and surface boundaries.
No changes in the near term forecast for today. Will be focusing on the next 24-48 hour as the offshore system moves east bringing dynamics with it. Early look still suggest some precip across the entire CWA. The biggest impacts will be tied to the potential convective threat along the Central Coast. Will coordinate with SPC to any updates on SVR Outlooks. Still looks like a low chc for some rotating cells to develop over the coastal waters off Big Sur Wednesday.
MM
Short Term
Issued at 1203 AM PDT Tue Oct 20 2026 (Today through Wednesday)
The low pressure system is already making its presence known as it nears our coast. Not only were there various cloud layers present on Monday, but some measurable rainfall has been observed in Northern California nearby Eureka (as of 10 PM PDT Monday). Given that the center of the low is still to our northwest, these rainbands are not expected to impact us just yet...
Overnight, the upper-level trough continues to dig southward along the coast and becomes fully cut-off from the main airflow by Tuesday. During the day, calm conditions are expected with below normal temperatures and infrequent wind gusts up to 20-25 mph. Later tonight, the cut-off low begins to slowly propagate eastward with the first few rainbands possibly impacting the southern Central Coast first. Through the overnight hours, these rainbands begin to make their way across the rest of the Central Coast and Bay Area.
Rain chances increase Wednesday with the North and East Bay less likely to experience wetting rain (>0.10 inch) during the event. Chances for wetting rain increase towards the Central Coast where the center of the cut-off low is expected to enhance moisture transport onshore. The eastern portion of the system is forecast to have stronger wind speeds than the western portion, likely due to a tighter pressure gradient downstream as well as a surge in momentum flux from the subtropical jet stream. This roughly coincides with where the most moisture, instability, and lift can be found. As a result, thunderstorm potential (<20%) remains the greatest along the Central Coast. The exact timing is uncertain, though model guidance is suggesting the highest probabilities are during Wednesday afternoon. Most unstable CAPE has trended slightly downward compared to yesterday, though it is still highlighting the Big Sur Coastline. The latest SPC convective outlook has upgraded Central and Southern California to a marginal severe thunderstorm risk, just south of the Monterey County border... Even though we are not included in the marginal severe risk, this is too close to comfort considering the proximity to the Timber and Plaskett fire burn scars. As the event draws closer, this will be an area of special interest not only for the potential of debris flows if rainfall thresholds are met, but also gusty and erratic winds that may result from low-topped thunderstorms.
Long Term
Issued at 1203 AM PDT Tue Oct 20 2026 (Wednesday night through Monday)
Overnight, the center of the low gradually moves across the region resulting in diminishing rainfall chances, though the Central Coast still remains with a 60-80%. Lingering rain showers persist through Thursday as the system continues its eastward track. Across the Bay Area, 20-40% rain chances persist with a 40-60% chance across the Central Coast.
By Friday, the trough center will be east of our area as high pressure gradually builds in its wake with a mean northerly wind flow. To balance out the recent disturbance, a slightly warmer and drier air mass settles over the region this weekend with seasonal temperatures in the 60s and 70s.
Forecasts, observations and alerts in the United States come from the National Weather Service (NOAA); radar from NOAA's Multi-Radar Multi-Sensor system; satellite imagery from NASA's Global Imagery Browse Services (GIBS) and NOAA's GOES satellites; the map from the U.S. Geological Survey's National Map; air quality from AirNow (EPA and its partners); hurricane information from the National Hurricane Center; climate normals and records from NOAA's Regional Climate Centers (ACIS). Forecasts outside the United States and the UV index: MET Norway (CC BY 4.0); observations outside the U.S.: airport reports via NOAA's Aviation Weather Center. Place names: GeoNames (CC BY 4.0). Data are copied on a schedule and may lag the sources; for warnings that affect your safety, follow your local National Weather Service office and emergency officials. Weather news is drawn from the 4Conservative index and reflects what the press published. Terms of use.